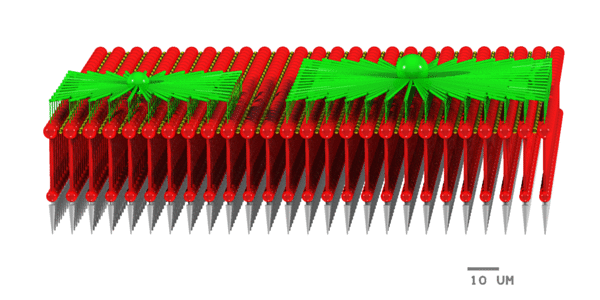

This shows part of the model. An array of 60x60 cones connects to an array of 14x14 type B horizontal cells (smaller, at left) and to an array of 7x7 type A horizontal cells (larger, at right). Cones and gap junctions are homologously coupled by gap junctions which spread the neural signals but reduce noise.

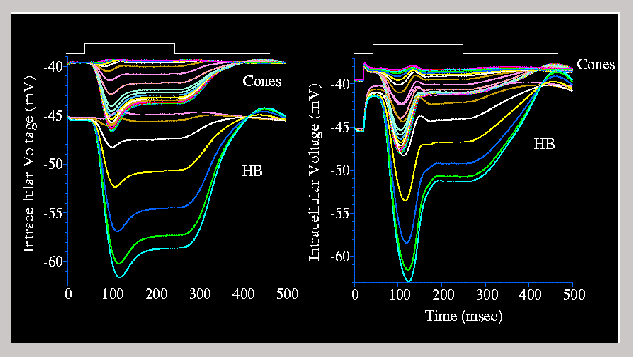
The left graph shows a response of the model to a spot of light 150 um in diameter and 200 msec in duration. The records are from a row of cones and horizontal cells along a radius from the central neurons underneath the stimulus. The central cones have the largest hyperpolarizing (negative) response. The hyperpolarizing response decreases as the records progress to the edge of the array, and the cones on the edge depolarize slightly. The right graph shows the same network except with 20 pA of current injected into each photoreceptor. In this case the feedback is greater so the tonic response is reduced. A slight ringing instability shows that the feedback loop gain is increased. This is similar to actual temporal responses were oscillations have been found in recordings from horizontal cells.
Comments, questions, requests, etc., should be emailed to "rob@retina.anatomy.upenn.edu". -Rob